GET /map
Description
The /map endpoint queries weather forecast over a grid of points
in a map projection.
The /map method is useful for fetching and displaying forecast data
as a traditional weather map for a bounded region.
The service returns gridded forecast data, useful for
image rendering, contourline rendering and vector rendering.
Much of the heavy lifting relating to map projections
are taken care of by this service by providing a proj4=<proj string>
as argument.
Endpoint
GET https://api.route-weather.com/map
Query parameters
| Parameter | Value | Description |
|---|---|---|
| gridll | array | Grid definition within a lat/lon bounding box + grid resolution: (maxLat, minLon, minLat, maxLon, resolution). Grid resolution is w.r.t. the target proj4 coordinate system, usually in meters. See proj4=... option below. |
| grid | array | Grid definition within a projection bounding box (proj4 coordinates) + grid resolution: (maxY, minX, minY, maxX, resolution). Grid resolution is w.r.t. the target proj4 coordinate system, usually in meters. See proj4=... option below. |
| proj4 | string | A proj4 grid projection definition. Default is the Mercator projection, proj4='+proj=merc'. Please refer to the Proj4 standard for accepted proj4 definitions. |
| start | string | Start time for looking up forecast data, e.g. start=now or ISO time string start=2021-04-26T18:03. See waypoint time syntax. |
| stop | string | Stop time for looking up forecast data, e.g. stop=prev_plus_2h or ISO time string start=2021-04-26T20:03. See waypoint time syntax. |
| params | array of parameters | Forecast model and parameters to query. See parameter definitions. |
| view | view name | See view options. |
| scales | array of color scale defs | Defines color scale mapping of forecast parameter data to raster colors. Only has effect if rendering map data to raster images using view=image or view=jsonimage. E.g. scales=temp:(-10:blue,0:white,10:#f00),wind:(...),... If not provided default color maps will be applied. |
| token | string | Unique access key, see authorization api. |
| save | boolean [true/false] | Stores forecast data response so that can be recalled and shared using the saved endpoint. |
Compulsory query parameters are gridll or grid
Dedicated map views
The map service returns JSON formatted data results by default (view=json), same as all other
SeaMon-API services. However, depending on use case, it is often
advantageous to request the server to render the map data to rasterized forecast maps
using view=jsonimage or view=image.
Please refer to the following examples of dedicated map view options for rendering:
view=image
For map data it is often useful to get a preview of the rendered maps
in an image format.
For this reason, the view=image view on map data is provided.
It will selects the first available map result in the response and
render it to PNG, but this view will skip rendering any other parameters
or forecast time steps in the response.
More usually will want all time steps and parameters base64 encoded server side
and returned using the view=jsonimage view on the forecast data. See next section.
view=jsonimage
More usually, we may want all the JSON forecast map data to be rendered to
images on the server side, and for this reason the view=jsonimage view is provided.
This view on the data renders all forecast steps and parameters to a PNG image,
however base64 encoded as string within the JSON forecast response.
Note that base64 encoded images from within a JSON response are readily
interpreted by web-browsers and rendered to web-pages.
Using view=jsonimage has the special advantage of having all requested forecast data
rendered on the server side to PNG images and downloaded in a single request
to the API.
view=json (default)
You may want to receive the requested forecast data returned
numerically in JSON format using the default view, view=json.
This will require you to render the map data on the
client side. Rendering rasterized forecast maps in web-browsers
from raw numeric pixel data is often inefficient, or slow in modern
web-browsers. In such use cases it may be better to
request the server to render the rasterized maps (see view=jsonimage
and view=image above).
The main use-case for raw numeric map data, view=json, is to allow for
client side rendering of vectorized data, such as wind vectors
and contour lines.
In many circumstances you may want to combine requests to the server
with view=jsonimage for rasterized map data and view=json
for vectorized map data, in order to minimize client side
processing of the data.
Example request
JSON data
Raw map pixel data in JSON format using default view view=json.
Typically use this view on the data in order to perform client
side map rendering, such as for vectors and contour data
(e.g. wind vectors or air pressure):
https://api.route-weather.com/map?gridll=(-25,67,-13,63,5)¶ms=igb|temp&start=initial_time
Image
Mostly useful for testing during client side development.
In most cases it will be more useful to fetch many forecast time steps and parameters rendered
in advance using the view=jsonimage view on the data, see next section on view=jsonimage.
https://api.route-weather.com/map?gridll=(-25,67,-13,63,5)¶ms=igb|temp&start=initial_time&view=image
The default colormap is used for rendering if no scales=... argument is provided,
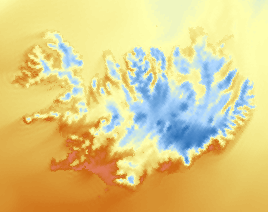
To control color rendering of the raster image, provide a scales=... argument for the forecast
parameters:
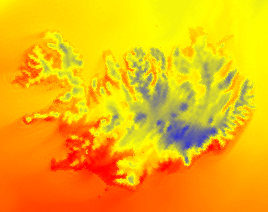
https://api.route-weather.com/map?gridll=(-25,67,-13,63,5)¶ms=igb|temp&start=initial_time&view=image
&scales=temp:(-10:blue,0:yellow,10:red)
JsonImage
To fetch PNG raster images for multiple forecast times and parameters, all base64 encoded within a JSON response:
https://api.route-weather.com/map?gridll=(-25,67,-13,63,5)¶ms=igb|temp&start=initial_time&view=jsonimage
scales=... definition as described above to control color rendering of
the forecast maps.